Designing a Food Tour Experience for Guests & Restaurants
Project at a Glance
Role: Lead UX Researcher & Service Designer
Methods: Service Design, Journey Mapping, Field Research, Surveys, Operational Strategy
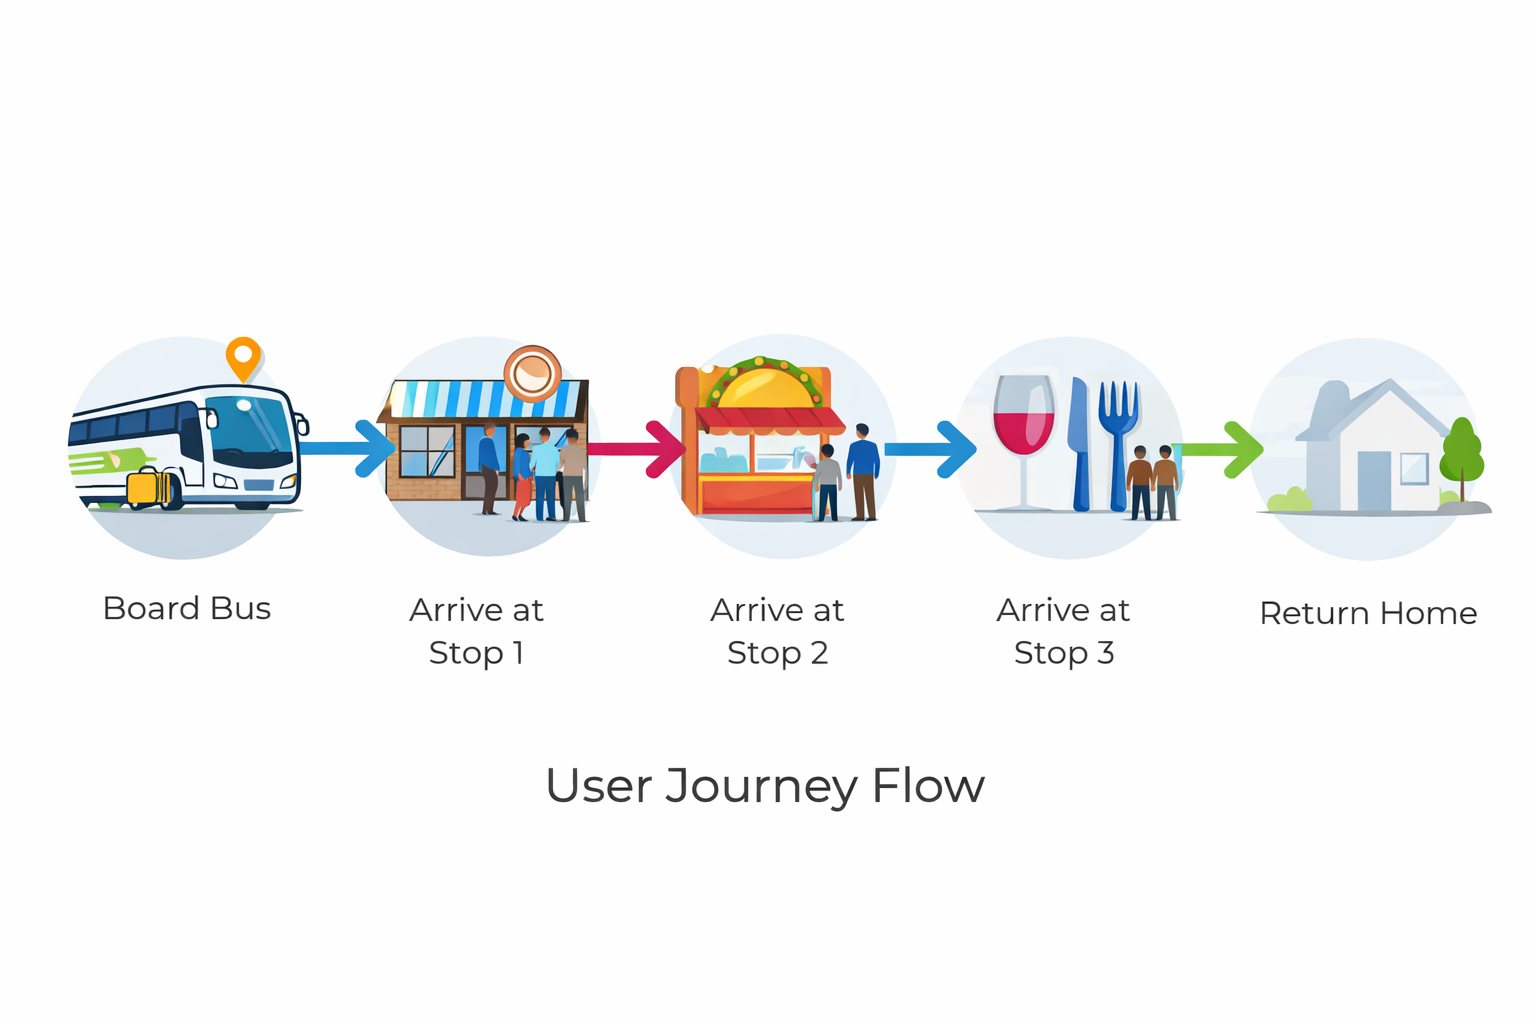
Format: Multi-Venue Food Tour
Overview: I led a field-based service design initiative for Sample Eat Review (S.E.R.), a hospitality research event helping local restaurants improve their guest experience from arrival to checkout.
The goal: deliver a repeatable tour model, real insights to business owners, and a frictionless experience for guests.
I created the research framework, ran field studies and interviews, and delivered insight-driven journey maps, scorecards, and recommendations that restaurants could act on immediately.
Challenge: Sample Eat Review was more than a food tour. It was a live, multi-stop hospitality experience with one core goal: help restaurants see their service through the eyes of real guests.
We had to:
Measure tour experience consistency across different venues
Measure what mattered most to guests
Deliver tangible, respectful feedback to restaurant partners
Capture operational blind spots, without disrupting service
“This wasn’t just a food crawl. It was a live, repeatable service audit with real people, real places, and real learning.”
Key Outcomes
Delivered feedback and opportunity reports to 4 local restaurants
Created a reusable research toolkit: journey map, scorecards, and feedback reporting
Identified key breakdowns in guest journey and service handoffs
Follow-up surveys showed improved satisfaction and future attendance interest
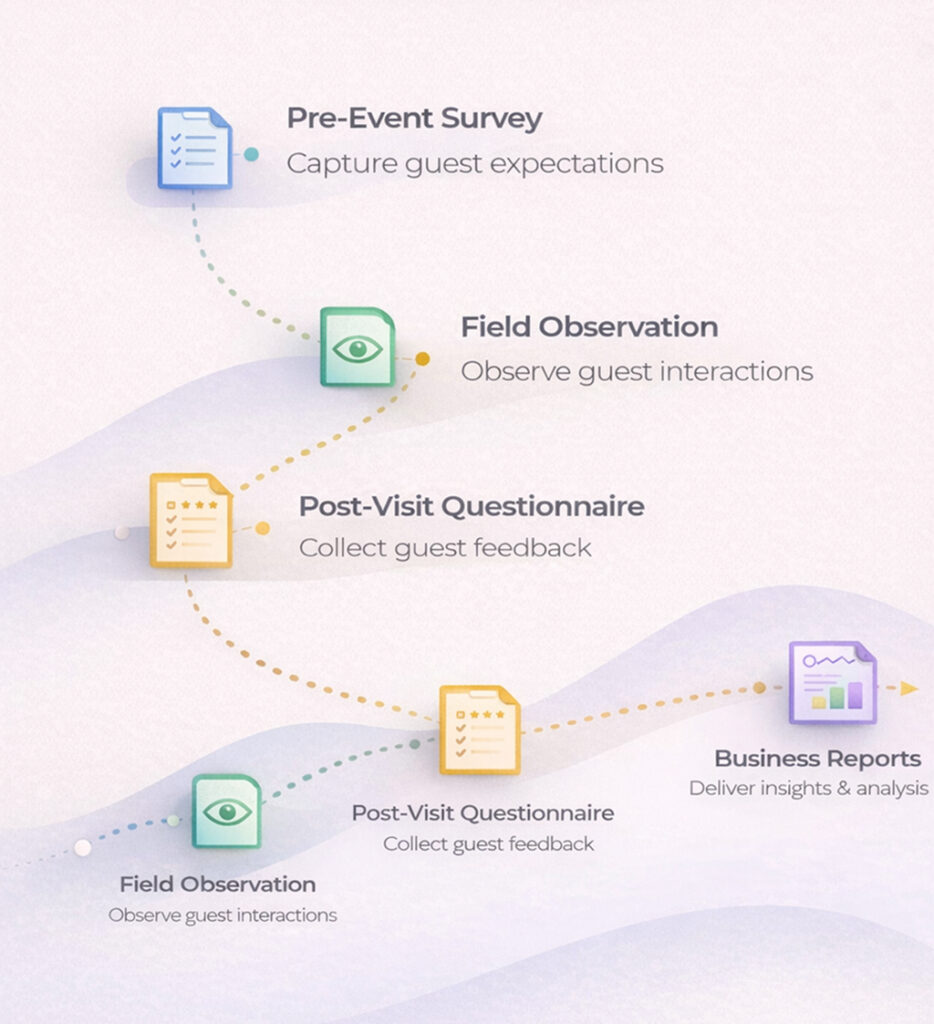
SER Research Framework
Research Process
Pre-Event Survey Captured guest expectations, preferences, and prior familiarity with each venue.
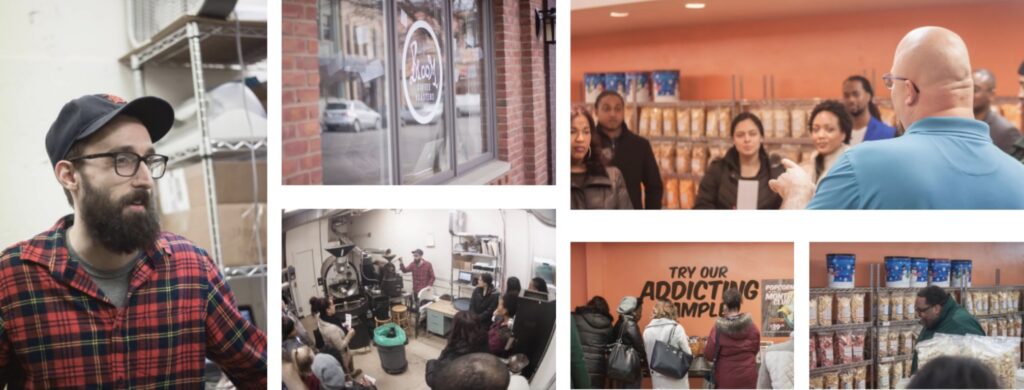
Field Observation Watched guests interact with the space, staff, and each other, tracking subtle moments of delight or confusion.
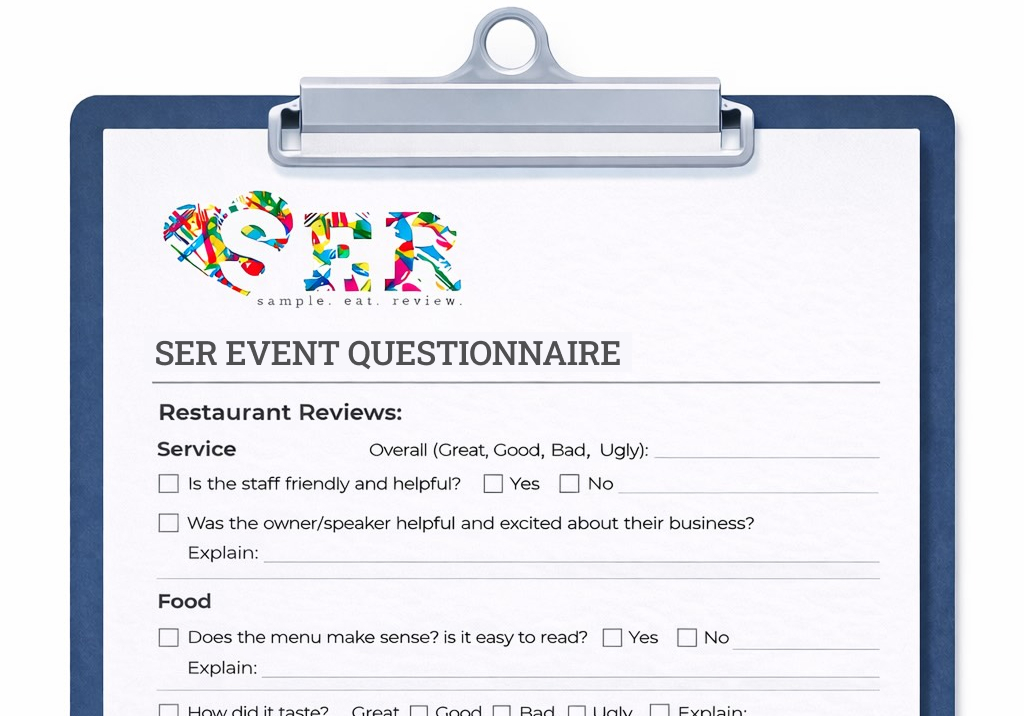
Post-Visit Questionnaire & Focus Group Sessions Collected NPS-style ratings, qualitative feedback, and open-ended responses for each restaurant.
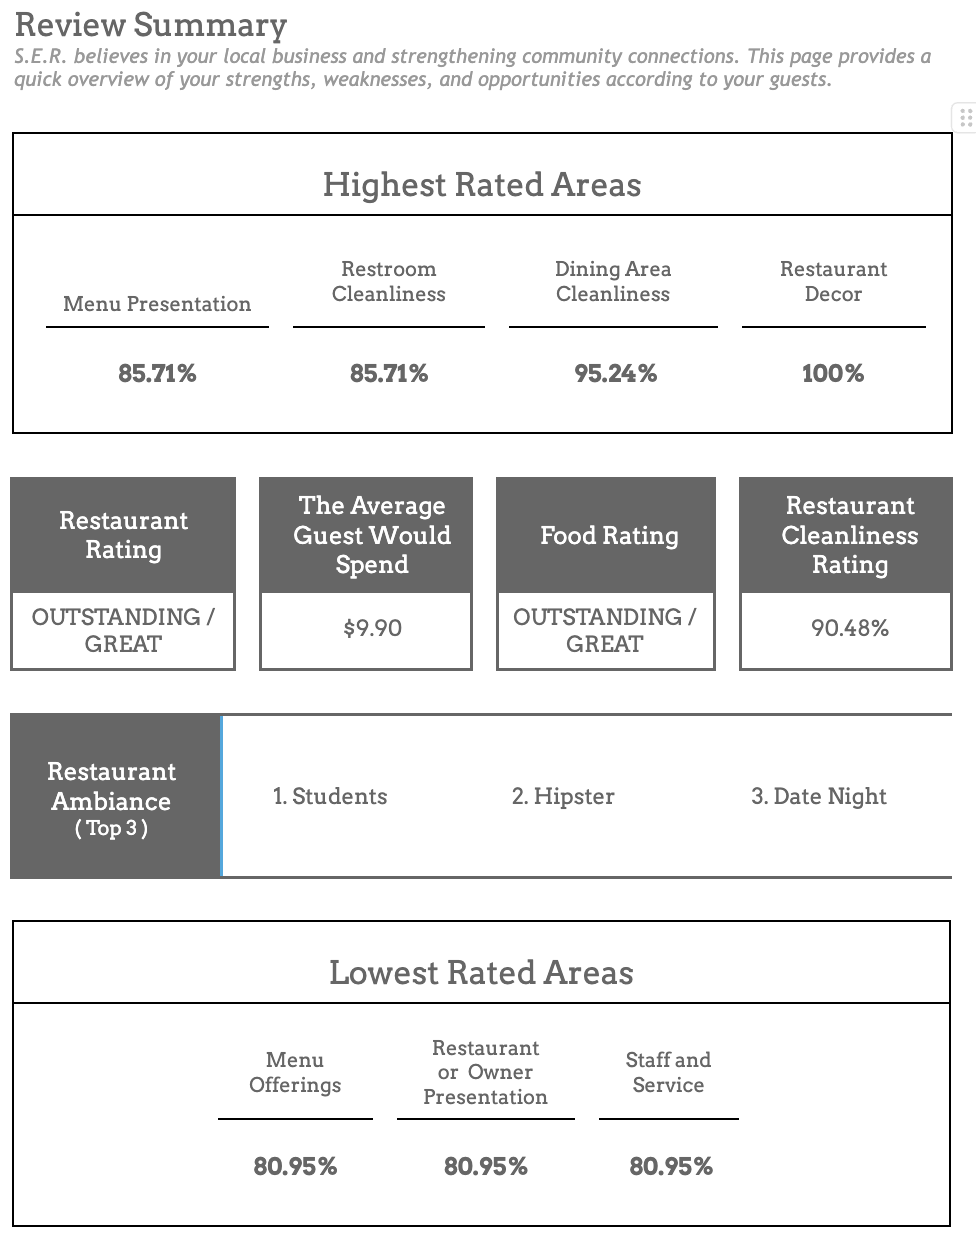
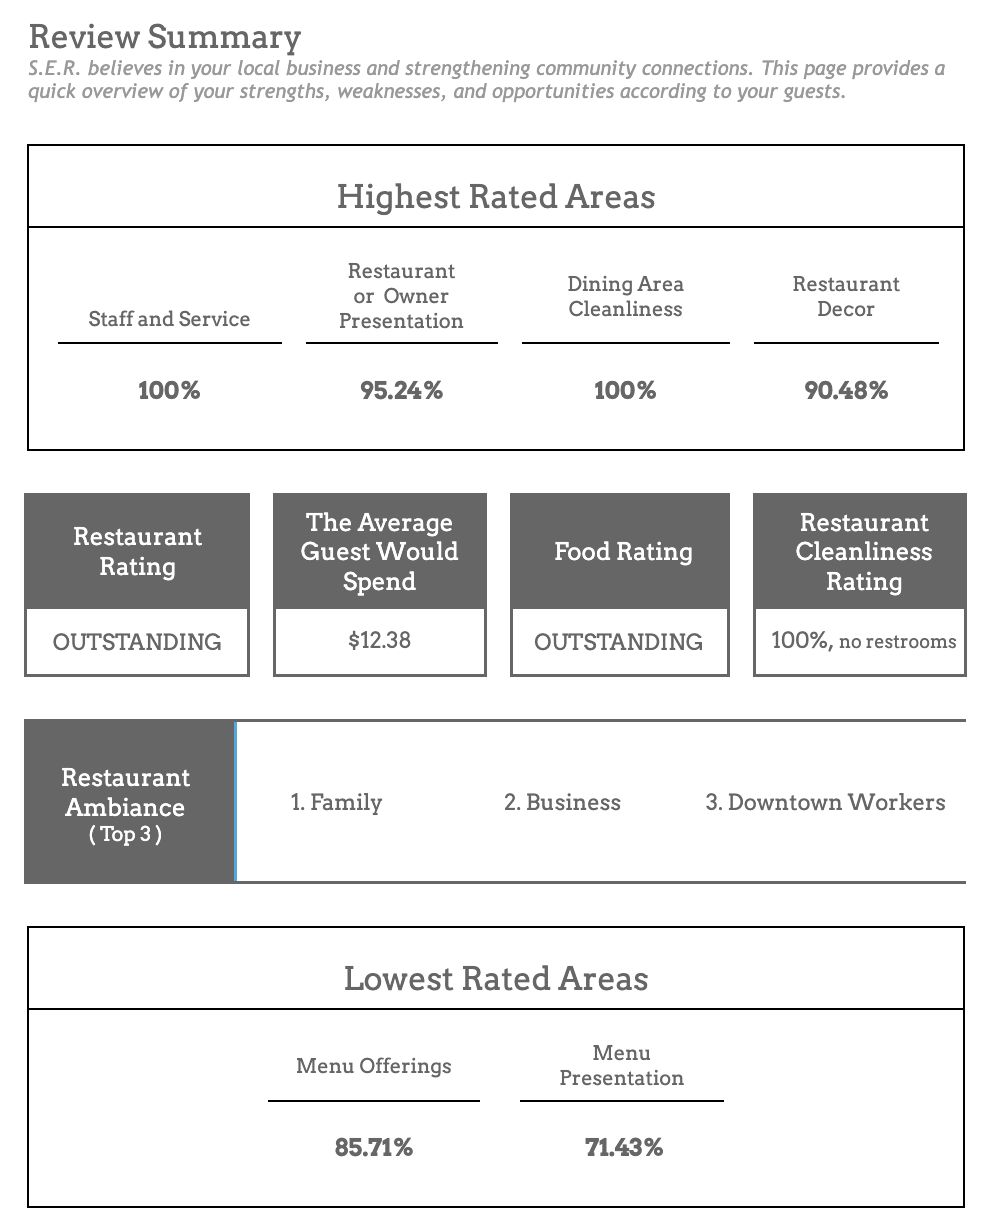
Business Reports Each restaurant received a detailed feedback summary with scores, direct customer feedback, and recommended next steps.
Breakdowns We Uncovered
From arrival confusion and inconsistent greetings to vague instructions during registration guests’ first impressions were often shaky. Once the tour began, however, engagement and enthusiasm grew with each stop.
Common breakdowns included:
Unclear check-in and parking signage
Hosts improvising directions or timing
Missed handoffs between restaurants and tour leaders
Low capture of actionable feedback for venues
But when the system clicked, guests lit up. They felt heard, hosted, and connected.
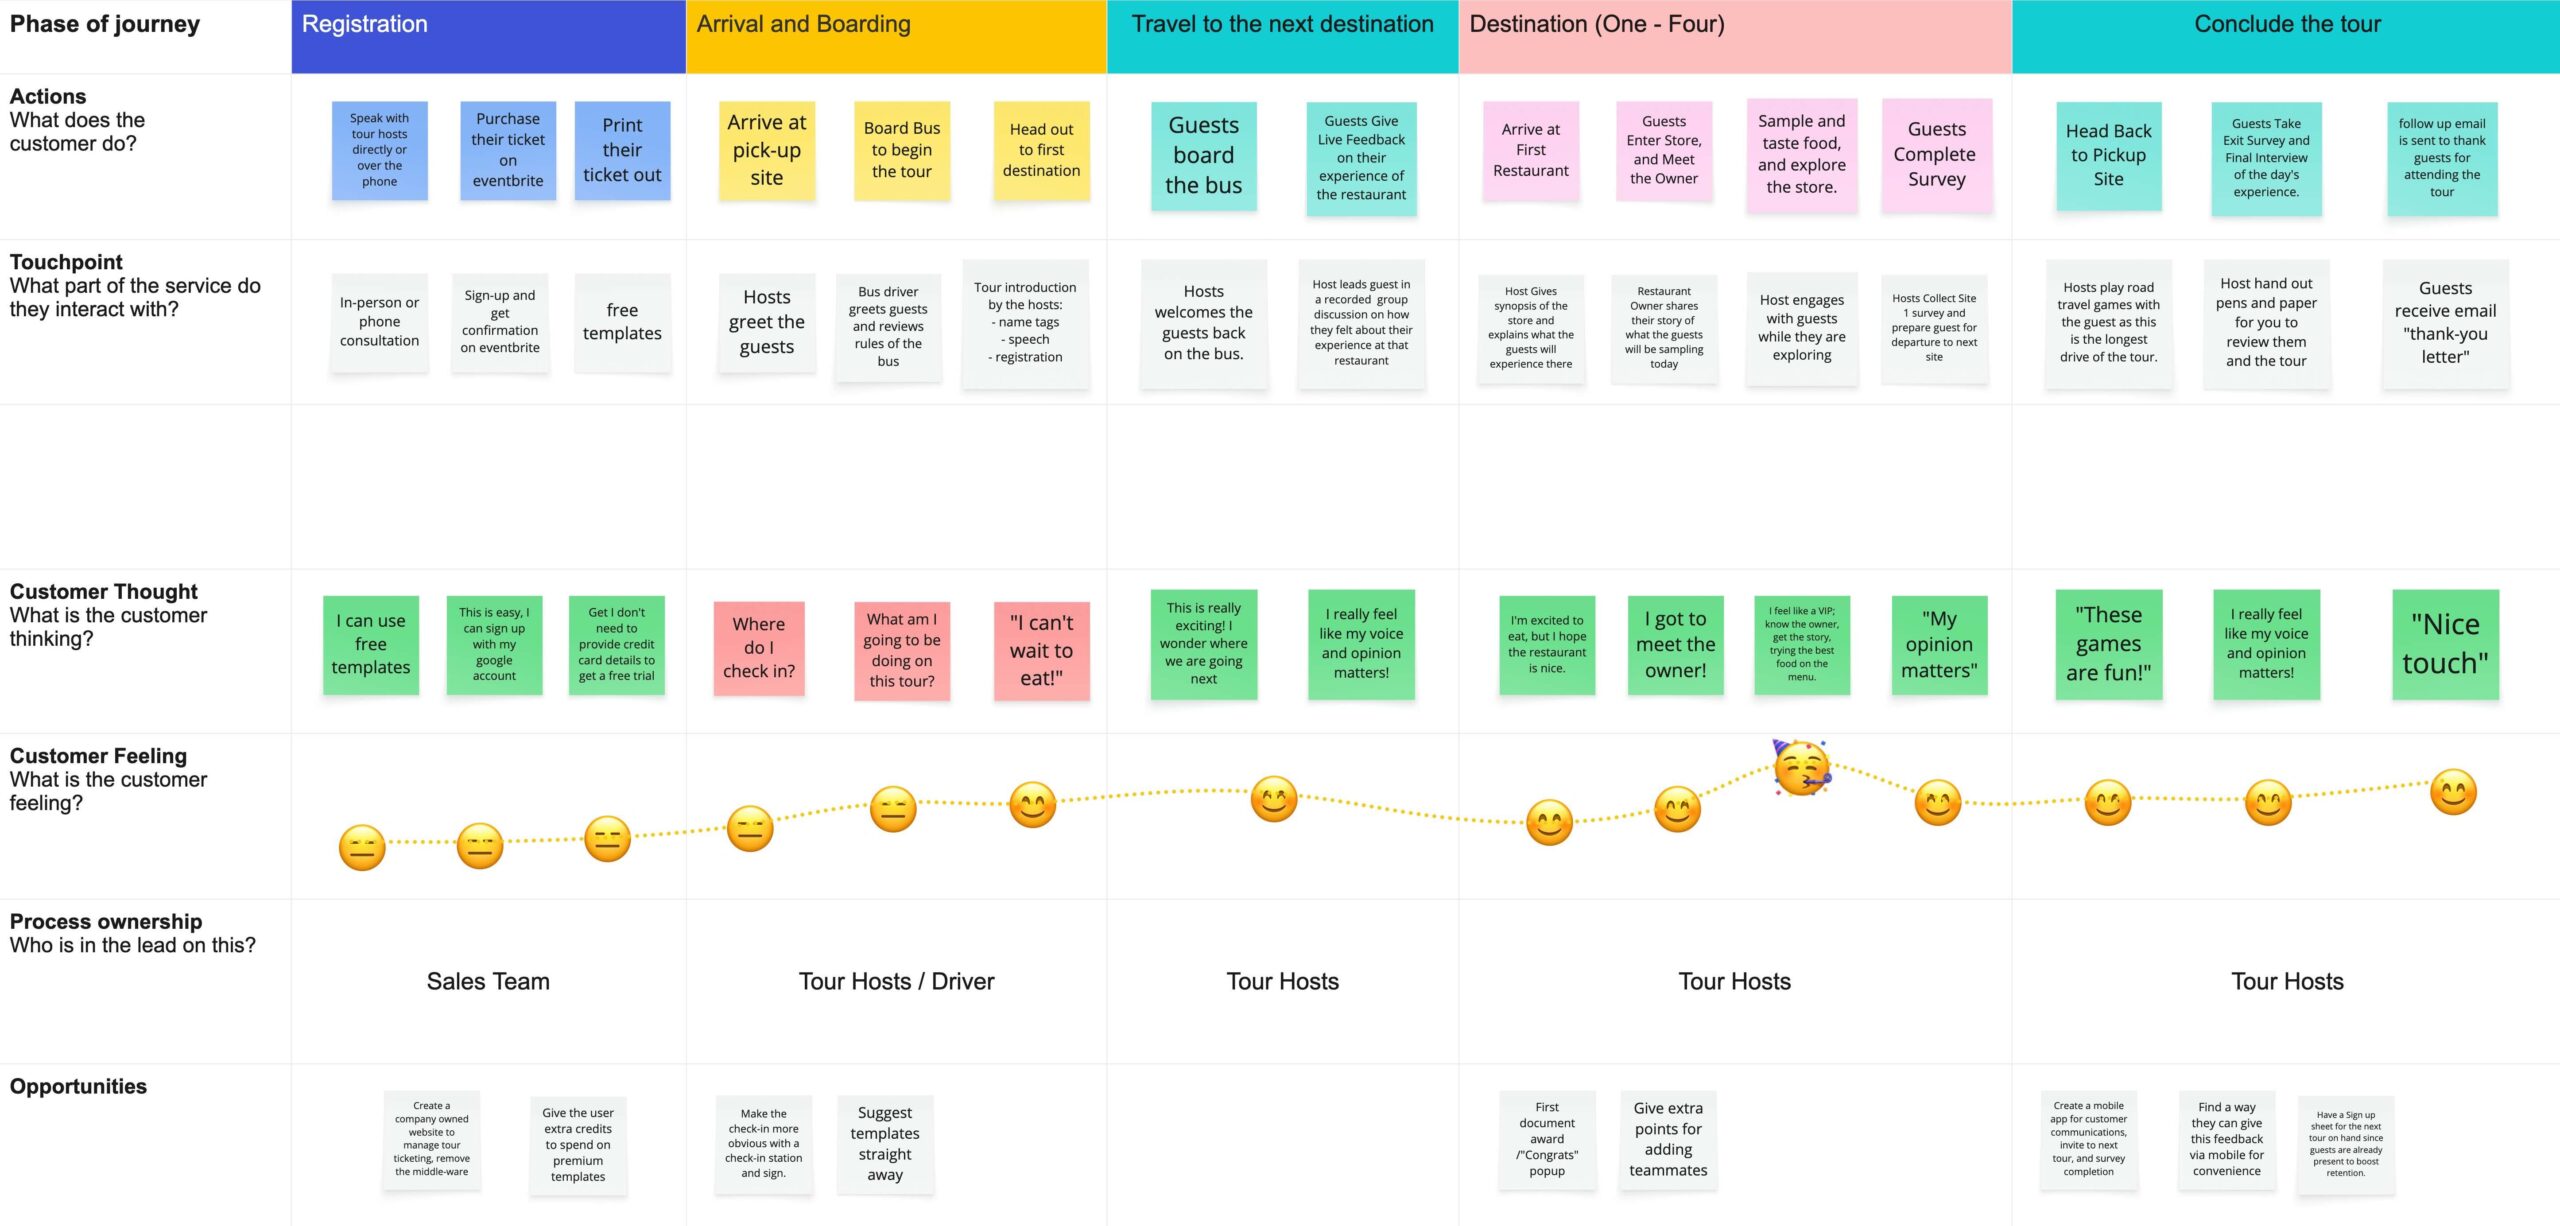
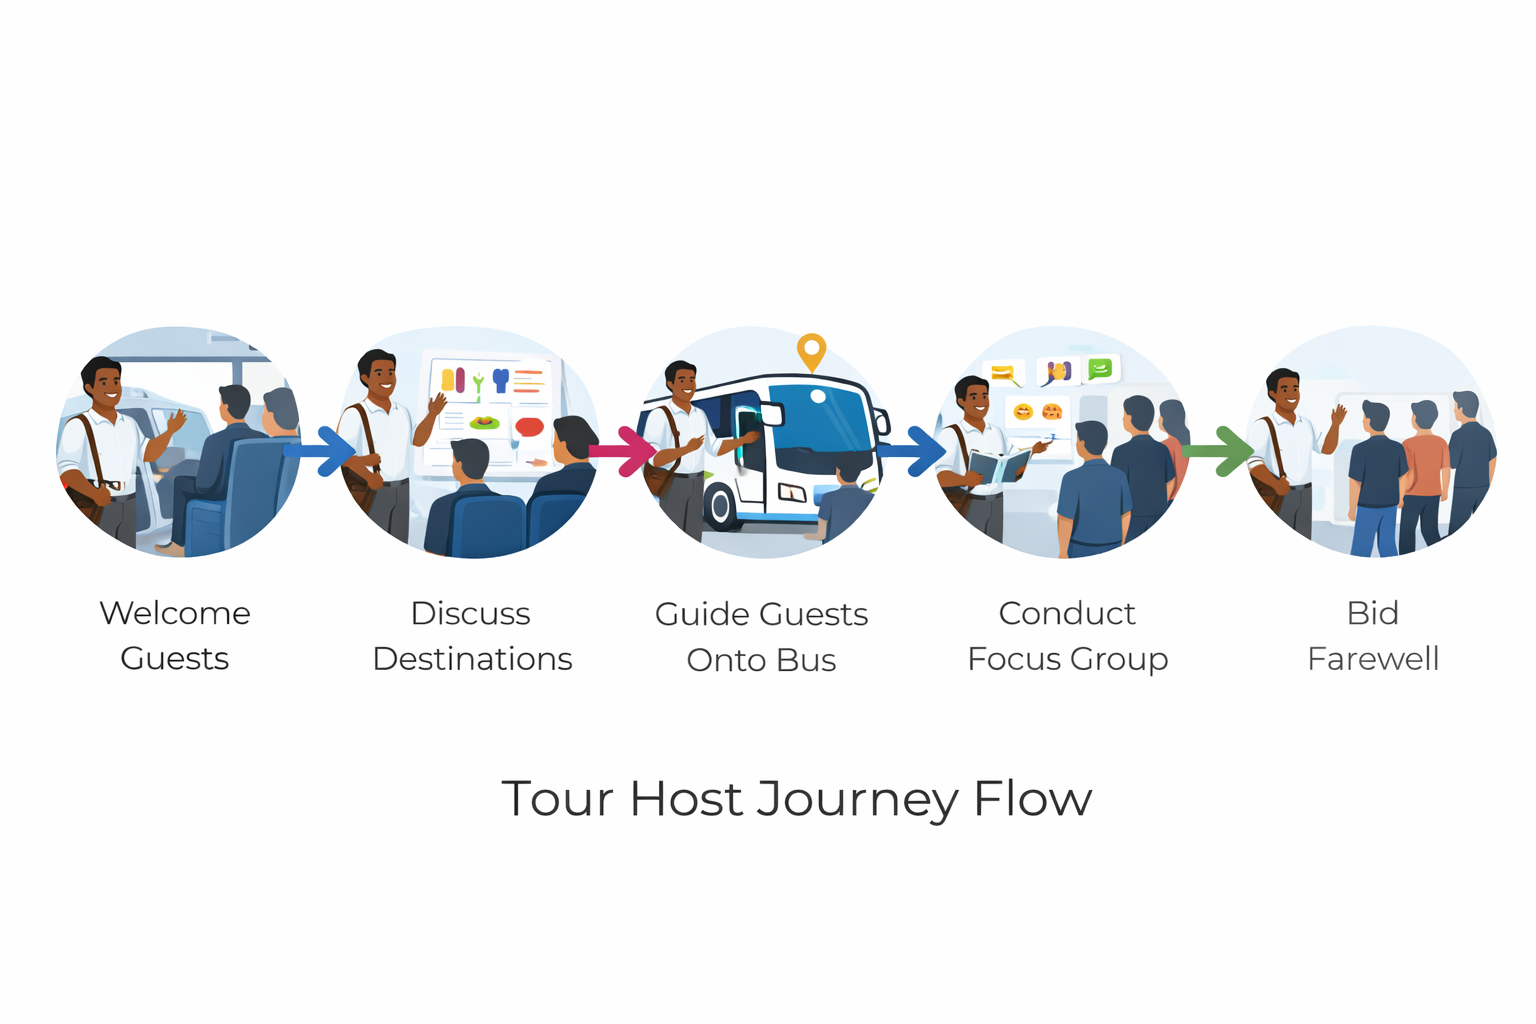
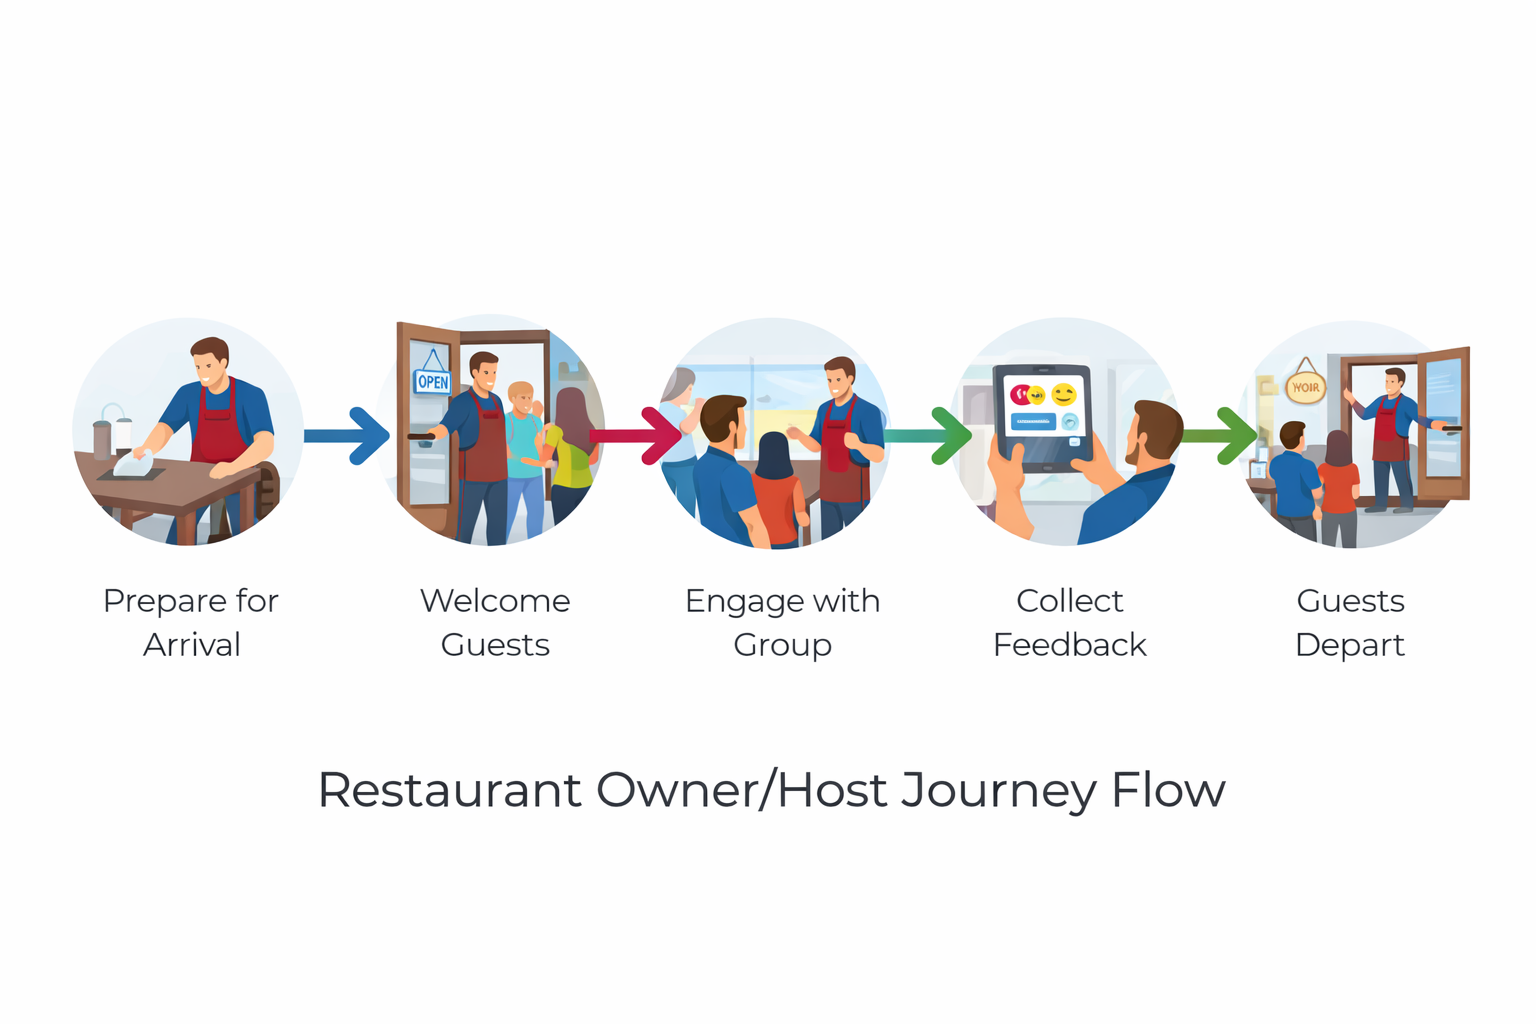
Service Journey Map
Key Artifacts
End-to-End Service Journey Map (Guest PoV)
Scorecard Templates (Quant + Qual Feedback per stop)
Experience Personas
Recommendations Report with phased rollout plan
Workshop Materials for scaling the format
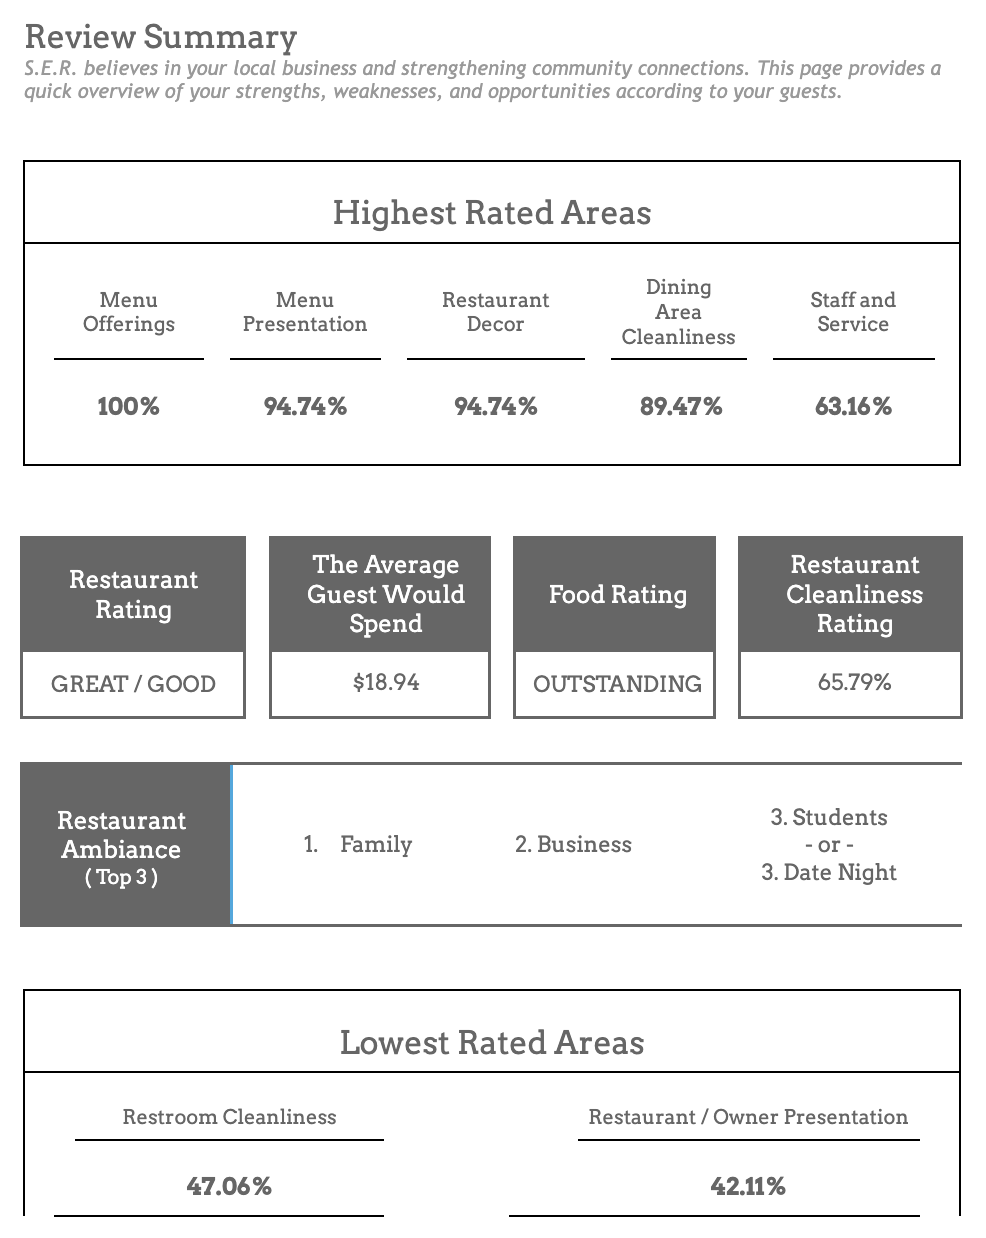
Restaurant Report Summary #1
Restaurant Report Summary #2
Restaurant Report Summary #3
Impact
Restaurant partners received custom reports with actionable feedback on guest experience, service handoffs, and operational pain points.
Tour organizers walked away with tools to replicate success across venues and events, increasing satisfaction and reducing guest confusion at scale. This created an easy transition for guests to participate in focus group discussions on the tour bus after venue visits.
What I Learned
Great service is about what happens between the touch points. This project reinforced how strategic UX research and systems thinking can elevate hospitality, even in fast-moving live settings.
Designing the structure of an experience is just as critical as designing the experience itself.